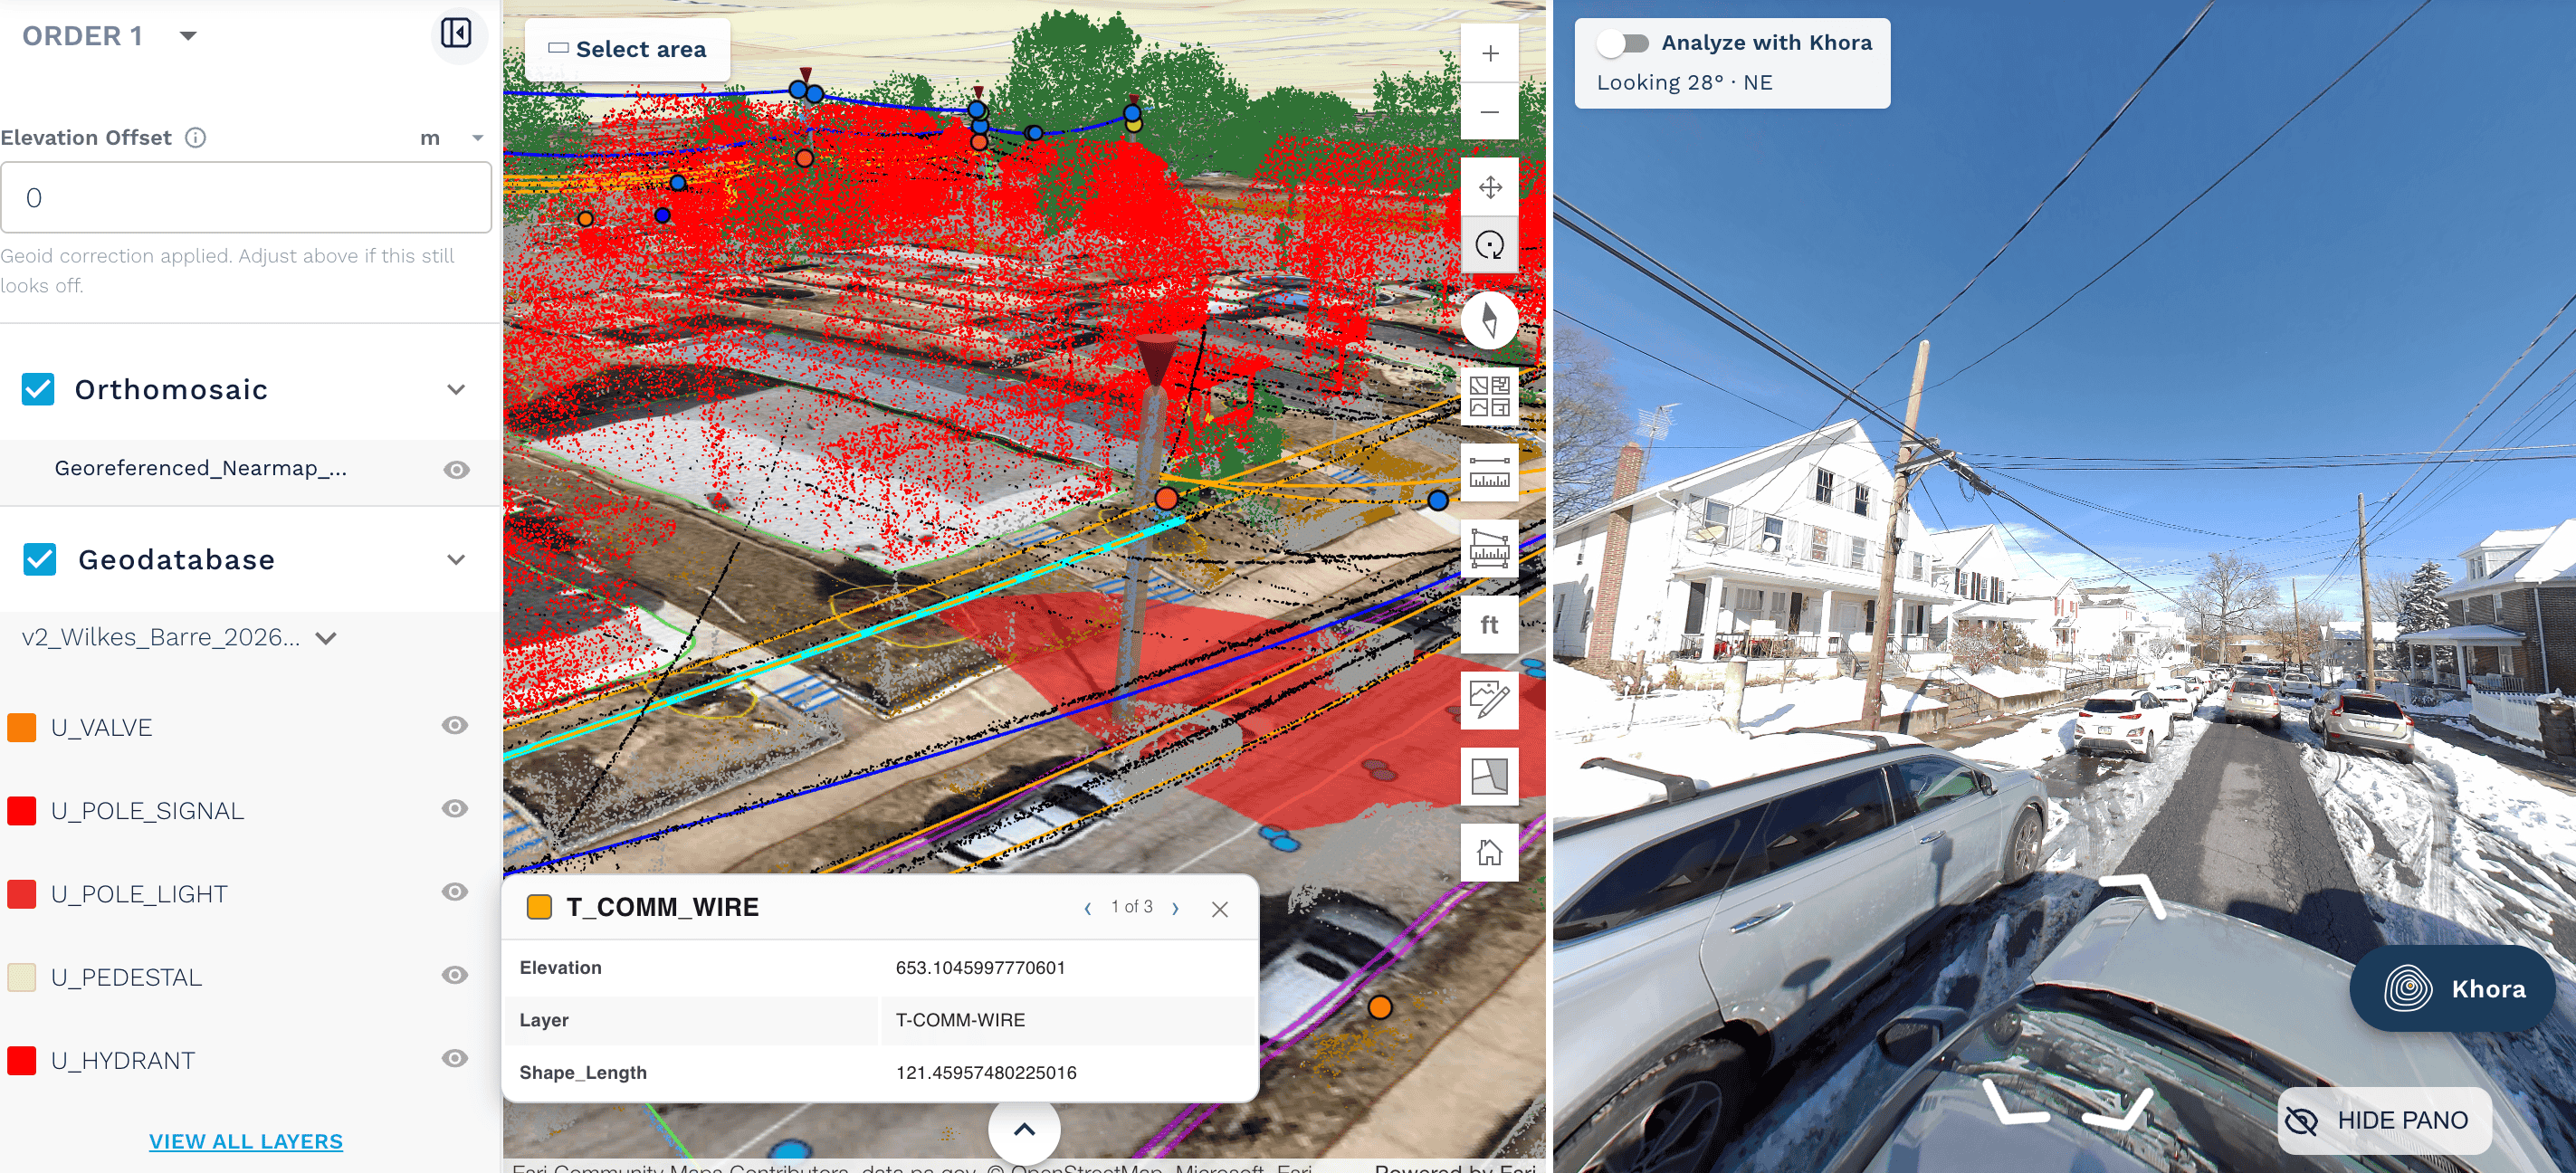
Engineering teams are working with more types of field data than ever, from LiDAR and photogrammetry to drone, mobile, and other field-captured datasets. Once processed, that raw field data can become feature vectors, classified point clouds, panoramas, and attribute information that engineers use to understand existing conditions and support design, planning, permitting, and other project work. Each form of project data can answer different questions, and many projects rely on several throughout the engineering process. As available digital information becomes richer, the challenge is ensuring teams can use that breadth of data without making the workflow overly complicated. Usability is key.
Creating a distinction between data volume and data value
A project might include vector data for design, imagery for visual context, a classified point cloud for 3D analysis, panoramas for reviewing field conditions, and attribute data associated with individual features.
Each can be valuable on its own, but the larger opportunity is making those resources useful together. What matters is whether a team can quickly get the information it needs, understand it in the context of the larger project, and apply it without unnecessary extra steps. That principle has been central to how we’ve approached the AirWorks Project Viewer.
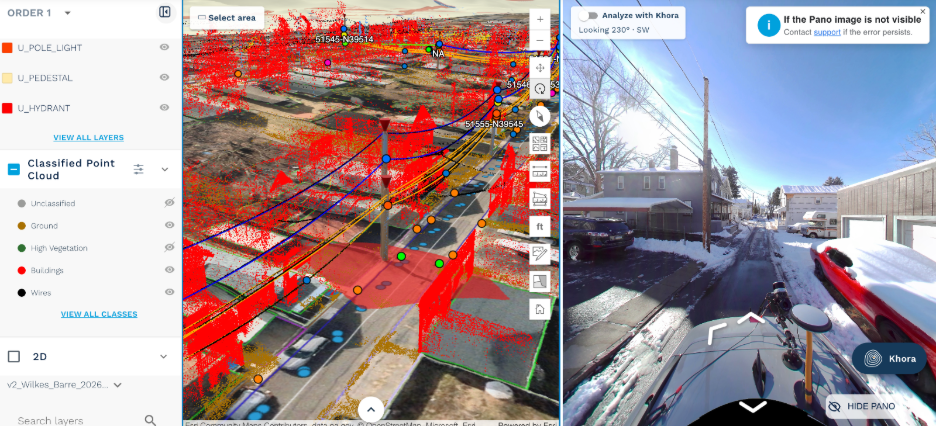
Consolidation makes complex data sets intuitive to work with
A natural tension exists between providing more information and keeping a workflow simple. As the number of available data types grows, so can the effort required to work across them, and frankly, to understand what you’re really looking at and how you’re going to work with it.
The Project Viewer brings AirWorks field intelligence together with available imagery, classified point clouds, panoramas, and tabular project information in a browser-based environment built on Esri technology. Rather than reducing the amount of information available, it provides a common place to access and understand it. That means a richer project doesn't have to become a more complicated project to navigate. On the contrary, by folding in the data layers you need into one view, the increased volume creates a corresponding increase in ease of use, thanks to a data visualization that conveys the ground truth comprehensively. With our new project viewer, you can bring your expertise back to the field.
The right representation depends on the engineering question.
No single method works best for every condition on a project. An engineer reviewing extracted features may want to see them directly against imagery. A question involving vertical conditions may be better answered using the classified point cloud. Panoramas can provide additional field context. Attribute information can help a user investigate specific features without relying on visual inspection alone.
The Project Viewer allows teams to move between these resources based on what they are trying to accomplish. It also provides dynamic tools to:
- Take line and area measurements.
- Review and isolate classified point cloud data.
- Add annotations for other project users.
- Query available project information
- Export tabular information to CSV
- Use panoramas for additional field verification.
The important part is not the number of tools available. It is the ability to use different parts of the project without losing the context that connects them.
Geospatial processing should reduce work downstream.
Speed in geospatial processing matters because engineering schedules matter. But processing time is only one part of how quickly project data can begin contributing to the work.
Teams still have to review the output, answer questions, verify conditions, communicate findings, and eventually move information into the systems where engineering work continues.
The Project Viewer extends the AirWorks approach to speed into that part of the workflow. By consolidating processed project data and providing multiple ways to interact with it, teams can spend less time unraveling the data and more time using it.
As geospatial datasets continue to become richer, we think that distinction will become increasingly important. The goal should not simply be to deliver more data. It should be to make more of that data practical to use.
%20(411%20x%20258%20px)%20(1).png)

.png)
.png)
.png)

